

Hi, I'm Ernest Dodson. I help Kansas City homeowners who need to sell an older house. Need to sell as-is? Let's talk
New construction homes in Kansas City: builders permit the most August homes since at least 2019 while sales slow
August single-family permits were the most since at least 2019, and January through August is about 40 percent ahead of last year. The count is still 370 short of the 2025 full year. September new-home sales still slowed. Here is what that means if the house you need to sell is the older one.
New construction homes in Kansas City had the most August permits since at least 2019, while sales slow. The builders association counted 629 single-family permits in August, up from 315. The prior high August on its 2019 to 2026 file was 502, in 2021. January through August 2026 is 4,018, about 40 percent ahead of those months of 2025 (2,873), and 370 short of the 2025 full year (4,388). September new-home closings still fell 11.2 percent.
New construction homes in Kansas City just had the most August permits since at least 2019, while new-home sales slow. The Home Builders Association of Greater Kansas City said on Oct. 6, 2026 that August brought 629 single-family permits, up from 315 a year earlier. The prior high August on its file was 502, in 2021. January through August 2026 totals 4,018, about 40 percent ahead of those months in 2025 (2,873), and 370 short of the 2025 full year of 4,388. September new-home closings still fell 11.2 percent, to 262, while existing-home closings fell 6.2 percent, to 2,854.
If you own the older house, builders are starting more homes even as fewer new ones closed in September. The published price still leaves out whatever a builder paid to get the deal done. Your number is the offer on one house, not the metro middle.
This report is part of the research library on the Saving KC Homebuyers site, filed with the Kansas City market reports. The September contract count for the five large counties is in pending sales, September 2026.
Why did new-home closings fall faster than older homes?
September new-home closings were 262, down from 295 a year earlier, and KCRAR calls that an 11.2 percent drop. Existing closings were 2,854, down from 3,043, a 6.2 percent drop. New-home days on market rose 8.4 percent. New-home supply moved from 5.4 months to 5.1. Year-to-date new closings were still up 4.3 percent.
The permit side of the same season is the other half of the story. The builders association published its August file on Oct. 6, 2026. Every month from January through August 2026 was above the same month of 2025, and August was the high point.
August 2026 was 629 single-family permits, the most August on this file since at least 2019.
| Month | 2025 | 2026 |
|---|---|---|
| Jan | 296 | 358 |
| Feb | 298 | 441 |
| Mar | 354 | 500 |
| Apr | 466 | 585 |
| May | 381 | 515 |
| Jun | 421 | 467 |
| Jul | 367 | 523 |
| Aug | 315 | 629 |
January through August 2026 was 4,018 single-family permits, about 40 percent ahead of January through August 2025, which was 2,873. That is 370 short of the 2025 full year of 4,388. August 2026 is the highest August on the file. The prior high was 502, in August 2021. January through August 2021 was 4,220, which is above this year's 4,018. The association said August was nearly 100 percent higher than August 2025.
KCRAR's September report says the Fed raised its benchmark a quarter point on Sept. 16, 2026, to a range of 3.75% to 4%, and that the 30-year mortgage moved above 7% in late September from an August average of 6.67%, citing Freddie Mac. That rate path is the association's account.
From January through September, new-construction closings were 2,665, up from 2,556 a year earlier. KCRAR states that change as +4.3%. September itself was the soft month.
New-home days on market rose 8.4% from a year earlier.
| Month | Existing homes | New construction |
|---|---|---|
| Oct | 35 | 102 |
| Nov | 37 | 96 |
| Dec | 43 | 106 |
| Jan | 51 | 125 |
| Feb | 51 | 117 |
| Mar | 43 | 125 |
| Apr | 38 | 136 |
| May | 30 | 124 |
| Jun | 29 | 116 |
| Jul | 30 | 113 |
| Aug | 32 | 107 |
| Sep | 35 | 116 |
The September averages were 116 days for a new home and 35 days for an existing home. A year earlier those averages were 107 and 32. The gap was already wide. The change this year is the 8.4 percent rise in the new-home wait.
New-home closings were 262 in September, down 11.2% from a year earlier.
| Month | Existing closings | New closings |
|---|---|---|
| Oct | 3,018 | 285 |
| Nov | 2,438 | 269 |
| Dec | 2,721 | 292 |
| Jan | 1,899 | 181 |
| Feb | 2,150 | 237 |
| Mar | 2,750 | 327 |
| Apr | 3,070 | 334 |
| May | 3,446 | 338 |
| Jun | 3,765 | 333 |
| Jul | 3,616 | 320 |
| Aug | 3,022 | 333 |
| Sep | 2,854 | 262 |
One-unit building permits are still ahead of last year's Census count even while September sales of new houses slowed. Census counted 5,202 one-unit homes permitted in the Kansas City, MO-KS metro in 2025, up from 4,875 in 2024. Through August 2026 the estimate was already 3,915, compared with 3,435 through August 2025.
Which counties permitted the most new houses?
Johnson County, Kansas permitted 2,055 one-unit homes in 2025, up from 1,733. Jackson County was next at 1,299. Among cities, Olathe permitted 527, Kansas City, Missouri 516, and Spring Hill 370. These are Census permit counts, not homes sold in September, and not the builders association August count.
The 2025 one-unit estimates were Johnson County, Kansas 2,055 (reported 2,052), Jackson County 1,299 (reported 1,262), Platte County 228 (reported 225), Wyandotte County 222 (reported 217), and Clay County 207 (reported 207). A year earlier the estimates were 1,733, 1,253, 237, 121, and 314.
Johnson County permitted 2,055 one-unit homes in 2025.
| County | 2024 estimate | 2025 estimate | 2025 reported |
|---|---|---|---|
| Johnson County, KS | 1,733 | 2,055 | 2,052 |
| Jackson County, MO | 1,253 | 1,299 | 1,262 |
| Platte County, MO | 237 | 228 | 225 |
| Wyandotte County, KS | 121 | 222 | 217 |
| Clay County, MO | 314 | 207 | 207 |
Among cities, Olathe led one-unit permits with 527, then Kansas City, Missouri at 516 and Spring Hill at 370. Raymore rose from 153 in 2024 to 169 in 2025. Overland Park fell from 404 to 304, and Lee's Summit from 298 to 219.
Olathe permitted 527 one-unit homes in 2025, up from 321.
| Place | 2024 one-unit | 2025 one-unit |
|---|---|---|
| Olathe | 321 | 527 |
| Kansas City, MO | 429 | 516 |
| Spring Hill | 243 | 370 |
| Overland Park | 404 | 304 |
| Lenexa | 283 | 230 |
| Lee's Summit | 298 | 219 |
| Kansas City, KS | 106 | 210 |
| Raymore | 153 | 169 |
| Blue Springs | 194 | 162 |
On the builders association map, which is not the Census map in the charts above, Spring Hill accounted for 153 of the 629 August permits and Johnson County accounted for 300. That file covers eight counties and counts each unit in a building of four or fewer. It is not added to the Census charts.
How do new construction homes in Kansas City change an older-home sale?
New homes were 1,491 of 8,832 listings in September, which is 16.9 percent, and 262 of 3,116 closings, which is 8.4 percent. Existing homes brought 96.7 percent of the original price. A longer new-home list does not set the price of an older house. The offer sheet on that house does.
Inventory was 7,341 existing homes and 1,491 new homes. Closings were 2,854 and 262. Pending sales were 2,382 existing and 238 new. None of those figures is a forecast for one address.
New homes were 16.9% of listings and 8.4% of closings.
| Measure | New | Existing | Combined | New share |
|---|---|---|---|---|
| Listings (inventory) | 1,491 | 7,341 | 8,832 | 16.9% |
| Closings | 262 | 2,854 | 3,116 | 8.4% |
New homes brought 99.7% of the original price. Existing homes brought 96.7%.
| Type | Percent of original list price |
|---|---|
| New construction | 99.7% |
| Existing homes | 96.7% |
| Difference | 3.0 points |
If you are going to list, the repair question is separate from the wait. Buyers who can tour a new house will notice a roof, a kitchen, or a foundation. The calculator leaves repairs blank until you type a quote. A related walk-through is selling when the house needs major repairs.
Do builder giveaways show up in the September price?
The middle new-home sale was $532,500 and the middle existing-home sale was $315,000. KCRAR says those prices do not account for seller concessions. No metro-wide dollar figure for builder incentives was in that report or in the local builder interviews used here.
New-home supply was 5.1 months. Existing-home supply was 2.5.
| Measure | Existing | New |
|---|---|---|
| Median sale price, Sep 2026 | $315,000 | $532,500 |
| Median sale price, Sep 2025 | $301,000 | $525,000 |
| Change stated by KCRAR | +4.7% | +1.4% |
| Months of supply, Sep 2026 | 2.5 | 5.1 |
| Months of supply, Sep 2025 | 2.6 | 5.4 |
What the headline numbers don't show
The September sales drop is real. It still leaves out the difference between a permit, an apartment building, a late report, and a house a buyer can tour this weekend.
Is a permit the same thing as a house for sale?
A permit is permission to start a building. It is not a listing and not a sale. Census counted 5,202 one-unit permits in the Kansas City metro in 2025. KCRAR counted 262 new-construction closings in September 2026. The August builders-association count uses a third map. Those starts are not this month's listings.
Did house permits and apartment permits move together?
Kansas City, Missouri one-unit permits rose from 429 to 516. Units in buildings of 5 or more fell from 2,160 to 1,161, so the city's total units fell from 2,878 to 1,869. Lee's Summit apartments in that size rose from 93 to 1,179. House permits and apartment permits are different products.
Metro house permits rose from 4,875 to 5,202. Kansas City, Missouri apartments fell.
| Place and type | 2024 | 2025 |
|---|---|---|
| Metro, 1-unit houses | 4,875 | 5,202 |
| Metro, 2-unit | 248 | 152 |
| Metro, 3 to 4 units | 630 | 261 |
| Metro, 5 or more | 3,395 | 4,278 |
| Kansas City, MO, 1-unit | 429 | 516 |
| Kansas City, MO, 2-unit | 38 | 56 |
| Kansas City, MO, 3 to 4 units | 251 | 136 |
| Kansas City, MO, 5 or more | 2,160 | 1,161 |
| Kansas City, MO, total units | 2,878 | 1,869 |
| Lee's Summit, 5 or more | 93 | 1,179 |
Which permit count is which?
The 2025 one-unit estimate is 5,202 and the reported-only count is 4,964. Five large counties sum to 4,011. Through August 2026 the estimate was 3,915 and the reported count was 3,577. Census fills in late offices inside the estimate. The Heartland sales map is wider than the Census metro.
A full year and a year to date are different counts.
| Count | Homes |
|---|---|
| 2025 metro estimate | 5,202 |
| 2025 metro reported only | 4,964 |
| 2024 metro estimate | 4,875 |
| 2024 metro reported only | 4,658 |
| 2025 five-county estimate | 4,011 |
| Jan to Aug 2026 estimate | 3,915 |
| Jan to Aug 2026 reported | 3,577 |
| Jan to Aug 2025 estimate | 3,435 |
| Jan to Aug 2025 reported | 2,978 |
Is older-home supply as loose as the new-home side?
Existing homes had 2.5 months of supply in September, down from 2.6 a year earlier, while new homes had 5.1, down from 5.4. Existing closings fell 6.2 percent. The middle existing price rose 4.7 percent, to $315,000. A shorter older-home list can sit next to a slower new-home list.
September existing closings fell, and the report calls that a 6.2 percent drop. Months of supply at 2.5 is still a short list. Owners who can wait on a clean, well-priced older home are not in the same spot as a builder with 5.1 months of new houses.
Year-to-date new closings are the other counterpoint. They were up, at 2,665 versus 2,556, even though September was down. One soft month is not the whole year.
What are local builders saying?
KCUR framed its July 12, 2026 story as a housing construction slump, but not in Kansas City. Citing the Census Bureau, the story said May permits in the metro rose 66.7 percent from May 2025 and 5.7 percent from April. Shawn Woods of Ashlar Homes described March through May as lackluster after a strong start.
Nick Erickson of the Housing Affordability Institute said that after Kansas City adopted a strict energy code, "production in Kansas City ground to a halt for a few months." The story says the city rolled back portions of that code in February 2026. The sales comments from Shawn Woods of Ashlar Homes in Blue Springs come from the same July 12 story.
"January and February, we started off the year incredibly well, so sales were way ahead of where they were in the previous year," he said. "And then March, April, and May have kind of been lackluster."
Shawn Woods, CEO, Ashlar Homes, Blue Springs, quoted by KCUR and Missouri Business Alert, July 12, 2026
Woods estimated Ashlar sold 20 to 25 percent fewer homes in March, April, and May than in those months of 2025. He also said a large pickup may have to wait.
"For any large uptick or large increase, I think we're going to have to wait till spring of next year, and see what the interest rates hold."
Shawn Woods, CEO, Ashlar Homes, Blue Springs, quoted by KCUR, July 12, 2026
What dates should a seller watch next?
Census posts September national construction on Oct. 20, 2026. On Oct. 27 it posts revised local permits and the new-home sales release. The Fed decides its benchmark on Oct. 28, which can change what a buyer is able to pay. KCRAR's September file is current as of Oct. 7. The October file was not up yet.
The Oct. 28 decision matters if you are trying to sell. The Federal Reserve sets a benchmark rate that day. Mortgage rates often move when that decision lands. A change in the mortgage rate changes the monthly payment a buyer can afford, which changes what they can offer for your house and whether they show up to see it. The meeting does not write your price.
- Oct 20, 2026CensusNew residential construction for September. Preliminary permits in that release are for the nation and regions.
- Oct 27, 2026CensusRevised building permits for metros, counties, and places, and the new-home sales release. Both land on the 17th workday of the month.
- Oct 28, 2026Federal ReserveThe rate decision. It can move what buyers are able to pay. The meeting runs Oct. 27 to 28 and follows the Sept. 15 to 16 meeting, whose minutes came out Oct. 7.
- Not posted yetKCRARThe September indicators file is current as of Oct. 7, 2026. The October file was not up when this page was written on Oct. 15.
- Dec 8 to 9Federal ReserveThe last scheduled FOMC meeting of 2026. The Fed's calendar marks it as a meeting with new economic projections.
Release dates: Census building permits schedule, Census new residential sales, and the FOMC calendar.
What does this mean if you have to sell on a deadline?
A tax sale date does not move because a new house nearby is slow to sell. An empty inherited house still has taxes, insurance, and utilities. A landlord still has showings, or a vacant unit. The calculator uses the existing-home wait, your costs, and a cash offer you type yourself.
The sale date does not stretch
A county tax sale date stays put while a listing waits. If your deadline is sooner than a sale, check the date before you list.
Selling before a tax saleThe empty house still has bills
Heirs often pay taxes, insurance, and utilities on a house nobody lives in. Each extra month is another round of bills. Probate can also set the earliest day you are allowed to close.
How probate affects a saleShowings, or a vacant unit
Listing a rental means working around a tenant or leaving the unit empty. A new house nearby can take the buyer who wanted a clean move-in.
Selling a rental with tenantsWhat does listing and waiting cost compared with a cash sale?
The tool starts from two September existing-home figures: 35 days to an accepted offer and 96.7 percent of the original price, the metro average. You add days to close, monthly costs, repairs, commission and closing costs, and a cash offer. A blank cash offer is not compared.
Existing homes in September 2026 averaged 35 days to an accepted offer and brought 96.7% of the original list price, the metro average. KCRAR Monthly Indicators, current as of Oct. 7, 2026.
A cash as-is number for your house is a separate conversation. Talk with Ernest or call (816) 608-8588.
More on this desk: the October investor update and the Missouri property tax guide.
■ ■ ■PRESSURE
A cash number for the house as it is
We buy houses as-is in the Kansas City area. You can get a number and decide later. This is not a listing pitch.
How did we report this?
Sales numbers are the KCRAR September 2026 indicators, current as of Oct. 7, and that report says the data are Heartland MLS totals. Permit numbers are Census files for metro 28140, counties, and cities, plus the builders association August count. Divisions and subtractions are listed once below. No listing file was used.
Method
- Geography. KCRAR says its sales data are Heartland MLS totals. That region is wider than Census metro 28140, the Kansas City, MO-KS core based statistical area. County and city permit rows are not the sales map.
- Days and prices. Days on market until sale is the average number of days between the list date and an accepted offer, not a median. The median sale price and the average sale price do not account for seller concessions. KCRAR states the one-year changes used here, including new-home days on market +8.4 percent, new closings -11.2 percent, existing closings -6.2 percent, and new supply from 5.4 months to 5.1.
- Arithmetic on this page. 1,491 / 8,832 = 16.9 percent of listings. 262 / 3,116 = 8.4 percent of closings. 99.7 minus 96.7 = 3.0 points. $532,500 minus $315,000 = $217,500. Five-county one-unit estimates 2,055 + 1,299 + 228 + 222 + 207 = 4,011. Metro estimate 5,202 minus reported 4,964 = 238. Metro 5,202 minus 4,011 = 1,191. Kansas City, Missouri units 516 + 56 + 136 + 1,161 = 1,869 in 2025 and 429 + 38 + 251 + 2,160 = 2,878 in 2024. The builders association year-to-date table prints 4,018 for January through August 2026 and 2,873 for those months of 2025. 4,018 is about 40 percent ahead of 2,873. The 2025 single-family full year on that file is 4,388, and 4,388 minus 4,018 is 370. January through August 2021 on the same table is 4,220. The eight monthly cells for 2025 add to 2,898, which is not the 2,873 in the year-to-date table. This page uses the year-to-date table.
- Permits. Census estimates fill in late permit offices. Reported-only counts leave those offices out. City permit offices can cover land outside the city: the Kansas City, Missouri office also covers its Cass, Clay, and Platte portions; Kansas City, Kansas covers some unincorporated area; Spring Hill covers a Miami County portion; Lee's Summit covers a Cass County portion. City rows were not added to county rows. Permits were not added to sales. Valuation was left out.
- Builders association. The Home Builders Association of Greater Kansas City count covers eight counties (Johnson, Clay, Jackson, Platte, Cass, Leavenworth, Miami, and Wyandotte) and treats a building of four or fewer units as single-family, with each unit counted. Starting in 2026, Kansas City, Missouri totals on this file include townhouse permits of up to 4 units. Those units were left out of earlier Kansas City, Missouri counts, so 2026 is not a like-for-like comparison with earlier years. That series is not the Census one-unit series, and the two counts are not added together. The association says it may revise monthly and year-to-date figures. On the August 2026 file, the single-family full years are 3,947 in 2023, 4,509 in 2024, and 4,388 in 2025. The figures 2,677, 2,915, and 2,873 are January-through-August counts. The association's own Oct. 6, 2026 post mislabels those January-through-August counts as the entire annual totals.
- Rates. This page has no weekly Freddie Mac file of its own. The sentence about a mortgage above 7 percent is KCRAR's, citing Freddie Mac.
- Calculator. 35 days and 96.7 percent of the original list price, the metro average for existing homes in September, are the only filled-in market figures. Asking price, monthly cost, repairs, commission and closing costs, days to close, and the cash offer start blank. Holding cost uses a 30-day month chosen for this tool. A blank line is left out of the total. The large figure is the cash offer minus the list net. No commission rate is filled in.
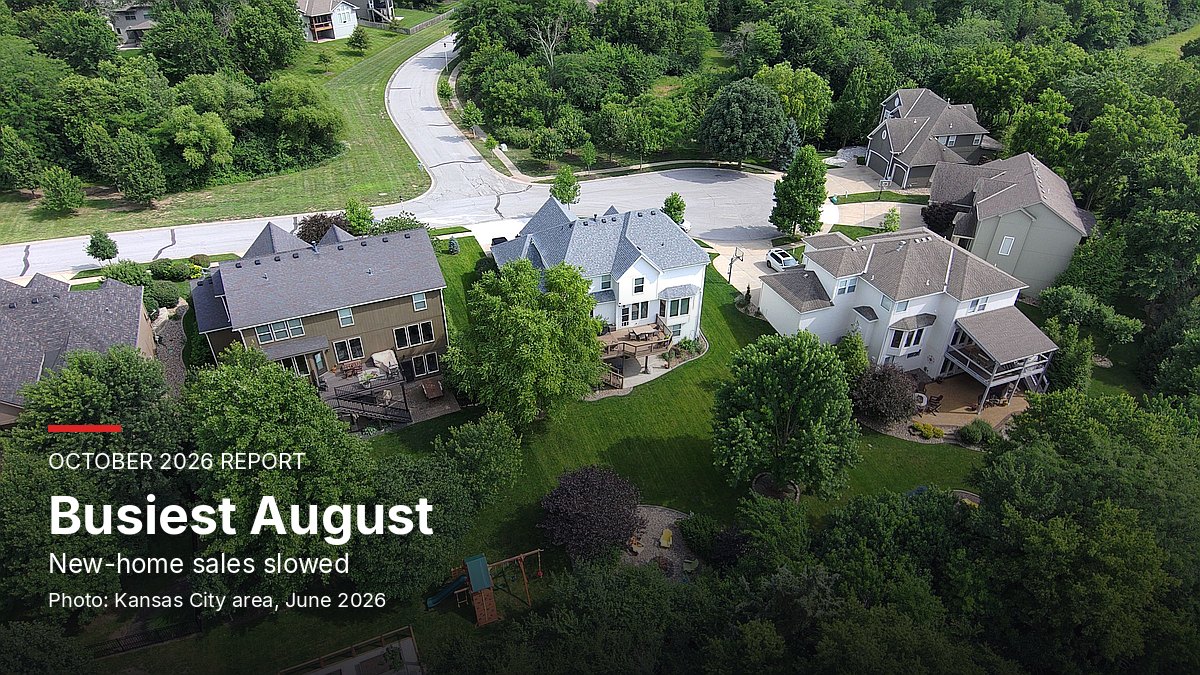
- Photo. The hero is a Kansas City-area neighborhood photographed by David McBee in June 2026 and published on Pexels. It is not a build site. It stays until there is a photograph of a Spring Hill site.
- No quote or scene was made up. Quotes are from the named published sources.
What we could not get
- A metro-wide dollar amount for builder incentives or concessions.
- County-level new-versus-existing days on market. No Heartland MLS listing export was used.
- A weekly Freddie Mac rate series. The mortgage sentence is KCRAR's.
- A photograph of a Spring Hill construction site. The hero is a Kansas City-area neighborhood from June 2026.
Sources
- KCRAR Monthly Indicators, September 2026. Heartland MLS region. Current as of Oct. 7, 2026. Accessed Oct. 15, 2026.
- KCUR / Missouri Business Alert, Misbahul Haque. Published July 12, 2026. Shawn Woods of Ashlar Homes in Blue Springs, and the May permit comparison.
- Home Builders Association of Greater Kansas City. August 2026 residential permit report, published Oct. 6, 2026. Monthly units are from the August 2026 permit statistics PDF.
- U.S. Census Bureau, Building Permits Survey.
- CBSA annual 2025 and CBSA annual 2024, code 28140.
- CBSA year-to-date through August 2026 and through August 2025.
- County annual 2025 and county annual 2024.
- Midwest places 2025 and 2024.
- Census permits release schedule and new residential sales. September 2026: construction on Oct. 20, revised permits and new-home sales on Oct. 27.
- Federal Reserve, FOMC calendars. Sept. 15 to 16, Oct. 27 to 28, and Dec. 8 to 9, 2026.
- Photo: David McBee, aerial view of a suburban neighborhood, Overland Park, June 20, 2026, Pexels License.
Frequently asked questions
What builder incentives are Kansas City builders offering right now?
No Kansas City dollar figure for builder incentives is published. The September KCRAR report says sale prices leave out seller concessions, and it prints no metro total for rate buydowns or closing credits. The July 12, 2026 interviews with local builders do not give a dollar figure either.
Is it a bad time to sell an older house?
Existing homes had 2.5 months of supply in September, and closings fell 6.2 percent from a year earlier. The middle existing price was $315,000, up 4.7 percent. New-home closings fell faster, at 11.2 percent, and new-home supply was 5.1 months. An older house is not in the same spot as a new one. One month is not your forecast.
Should I wait for the Oct. 28 Fed meeting before I sell?
The Oct. 28 decision can move mortgage rates. Rates change the payment a buyer can afford, which changes what they can offer and whether they tour your house. The meeting does not set your price. KCRAR's September note, citing Freddie Mac, said the 30-year mortgage moved above 7 percent in late September. That sentence is the association's.
Do this year's permits mean more new houses for sale this month?
No. Census counted 5,202 one-unit permits in the metro for 2025, and 3,915 through August 2026. A permit lets a builder start. It does not mean the house is listed. September new-home closings were 262. The Home Builders Association counted 629 single-family permits in August on its own map. Those starts are not this month's tours.
Which suburbs added the most new houses?
Olathe permitted 527 one-unit homes in 2025, up from 321. Kansas City, Missouri rose from 429 to 516, and Spring Hill from 243 to 370. Overland Park fell from 404 to 304, and Lee's Summit from 298 to 219. These are permits for the year, not September sales.
Will a cash sale beat listing my older house?
This page cannot say that for your house. The calculator uses the September existing-home wait of 35 days and 96.7 percent of the original price, then the repairs, monthly costs, and days to close you type, plus the cash offer you type. A blank cash offer is not compared. Call (816) 608-8588 for a number on your house.
When do these new-home numbers get updated?
Census releases September construction for the nation and regions on Oct. 20, 2026. On Oct. 27 it releases revised metro, county, and place permits, and the new-home sales report. The Fed meets Oct. 28. KCRAR's September file is dated Oct. 7. The October Heartland file was not up on Oct. 15, and this page does not guess that day.
Does the published new-home price include builder giveaways?
No. KCRAR says the median and the average sale price do not account for seller concessions. The September middle prices were $532,500 for new homes and $315,000 for existing homes. The $217,500 space between them is the gap between two middle prices, not a comp for your house, and it leaves out any credit a builder paid.
Who wrote this?

Ernest Dodson is an Acquisitions Analyst at Saving KC Homebuyers, a Kansas City metro real estate investing company with 11+ years of local experience. His focus is tax-delinquent homes and inherited property. The team has helped 100+ homeowners ready to sell find a way forward. You'll also find him on YouTube at @SavingKC. Have questions? Reach out and let's talk.
Ernest Dodson | Acquisitions Analyst | ernest@savingkc.com | (816) 608-8588 | MO License No. 2023026433 | Saving KC Homebuyers
Press and reporter quotes: email ernest@savingkc.com or call (816) 608-8588.
Disclosure. Ernest Dodson is a Missouri-licensed real estate salesperson with Platinum Realty LLC (MO License No. 2023026433). Saving KC Homebuyers buys houses as an investor. One or more principals of Saving KC Homebuyers hold a real estate license in Missouri with Platinum Realty LLC.